Forex trading often feels fast, chaotic, and overwhelming. Prices move constantly, news flows nonstop, and indicators crowd the screen. In the middle of all that noise, traders are looking for something simple, reliable, and repeatable.
That’s where pivot points come in.
Pivot points don’t predict the future. They don’t promise perfect entries. What they do offer is structure — clear reference levels that help traders understand where price might react during a given time frame.
Used correctly, pivot points act like a map. And in trading, having a map matters more than having a crystal ball.
This article explains what pivot points are, why time frame matters, and how traders align pivot levels with their trading style to make better decisions.
What Are Pivot Points, Really?
Pivot points are price levels calculated using the previous period’s:
- High
- Low
- Close
From these values, traders derive:
- A central pivot point
- Support levels (S1, S2, S3)
- Resistance levels (R1, R2, R3)
These levels are not random. They reflect areas where price previously found balance — and where traders are likely to react again.
Pivot points are especially popular in forex because the market is liquid, global, and technically driven.
Why Pivot Points Matter in Forex Trading
Forex markets move largely on participation and expectation. Pivot points help traders answer key questions:
- Where might price stall?
- Where could momentum slow or reverse?
- Where is risk clearly defined?
Because pivot points are widely used, they often become self-fulfilling. The more traders watch them, the more relevant they become.
They are not magic.
They are common reference points.
The Role of Time Frame in Pivot Point Trading
Here’s the mistake many traders make: they use pivot points without considering time frame.
Pivot points are calculated based on a specific period:
- Daily
- Weekly
- Monthly
Each one serves a different type of trader.
Mapping your time frame correctly is what turns pivot points from lines on a chart into usable tools.
Daily Pivot Points: The Day Trader’s Map
Daily pivot points are calculated using the previous trading day’s data.
They are best suited for:
- Day traders
- Intraday scalpers
- Short-term momentum traders
Daily pivots help identify:
- Intraday support and resistance
- Potential reversal zones
- Areas for taking partial profits
For traders who open and close positions within the same day, daily pivots often act like invisible boundaries.
Weekly Pivot Points: Swing Traders’ Reference Levels
Weekly pivot points use the previous week’s high, low, and close.
They work best for:
- Swing traders
- Multi-day position holders
- Traders focused on broader market structure
Weekly pivots are stronger than daily pivots because they reflect more data and more participation.
Price reacting at a weekly pivot level often signals:
- Trend continuation
- Larger pullbacks
- Medium-term reversals
They help traders stay aligned with the “bigger picture.”
Monthly Pivot Points: The Institutional View
Monthly pivot points are calculated from the previous month.
They are most useful for:
- Position traders
- Long-term forex traders
- Traders tracking macro trends
Monthly pivots are slower, but powerful. When price approaches these levels, it often coincides with:
- Major decision zones
- High-volume participation
- Institutional interest
These levels are not about frequent trades. They are about context.
Choosing the Right Pivot for Your Trading Style
The best pivot point is not the most popular one — it’s the one that matches how you trade.
Ask yourself:
- How long do I hold trades?
- How often do I trade?
- How much noise can I tolerate?
A day trader using monthly pivots will feel lost.
A position trader using daily pivots will feel overactive.
Alignment matters.
How Traders Combine Pivot Points with Price Action
Pivot points work best when they are not used alone.
Many traders combine them with:
- Candlestick patterns
- Trend direction
- Market structure
- Volume behavior
For example:
- A rejection candle at a pivot level adds confirmation
- A strong break and hold above a pivot signals momentum
- Repeated failure at resistance suggests weakness
Pivot points define where to pay attention — price action tells you what to do.
Support and Resistance Are Not Lines — They’re Zones
One common misconception is treating pivot points as exact prices.
In reality, they function as zones:
- Areas of interest
- Decision regions
- Risk-definition zones
Price may overshoot slightly. That doesn’t invalidate the level.
Rigid thinking creates frustration.
Flexible interpretation creates consistency.
The CEO Mindset: Structure Over Prediction
Professional traders think like executives.
They don’t ask:
“Where will price go next?”
They ask:
- Where is risk clearly defined?
- Where does probability shift?
- Where can I be wrong cheaply?
Pivot points help answer those questions.
They are tools for decision-making, not fortune-telling.
Common Mistakes Traders Make with Pivot Points
- Using too many pivot sets at once
- Ignoring higher time frame pivots
- Trading every touch without confirmation
- Forcing trades in low-volume sessions
- Treating pivots as guaranteed reversals
Discipline matters more than indicators.
When Pivot Points Work Best
Pivot points tend to be most effective when:
- Markets are liquid
- Volatility is moderate
- Price is respecting structure
- Sessions overlap (London–New York)
They are less effective during:
- Extreme news events
- Thin liquidity periods
- Highly erratic markets
Context always matters.
Final Thoughts: Pivot Points Are a Map, Not a Shortcut
Pivot points don’t replace skill.
They organize it.
When aligned with the right time frame, pivot points help traders:
- Stay objective
- Reduce emotional decisions
- Define risk clearly
- Trade with structure
The market will always be uncertain.
But with the right map, you don’t need certainty — you just need direction.
End of article.
Summary:
It is useful to have a map and be able to see where the price is relative to previous market action. This way we can see how is the sentiment of traders and investors at any given moment, it also gives us a general idea of where the market is heading during the day. This information can help us decide which way to trade.
Keywords:
Forex trading system, forex pivot points, pivot points, forex trading system, forex training, forex trading course
Article Body:
It is useful to have a map and be able to see where the price is relative to previous market action. This way we can see how is the sentiment of traders and investors at any given moment, it also gives us a general idea of where the market is heading during the day. This information can help us decide which way to trade.
Pivot points, a technique developed by floor traders, help us see where the price is relative to previous market action.
As a definition, a pivot point is a turning point or condition. The same applies to the Forex market, the pivot point is a level in which the sentiment of the market changes from �bull� to �bear� or vice versa. If the market breaks this level up, then the sentiment is said to be a bull market and it is likely to continue its way up, on the other hand, if the market breaks this level down, then the sentiment is bear, and it is expected to continue its way down. Also at this level, the market is expected to have some kind of support/resistance, and if price can�t break the pivot point, a possible bounce from it is plausible.
Pivot points work best on highly liquid markets, like the spot currency market, but they can also be used in other markets as well.
Pivot Points
In a few words, pivot point is a level in which the sentiment of traders and investors changes from bull to bear or vice versa.
Why PP work?
They work simply because many individual traders and investors use and trust them, as well as bank and institutional traders. It is known to every trader that the pivot point is an important measure of strength and weakness of any market.
Calculating pivot points
There are several ways to arrive to the Pivot point. The method we found to have the most accurate results is calculated by taking the average of the high, low and close of a previous period (or session).
Pivot point (PP) = (High + Low + Close) / 3
Take for instance the following EUR/USD information from the previous session:
Open: 1.2386
High: 1.2474
Low: 1.2376
Close: 1.2458
The PP would be,
PP = (1.2474 + 1.2376 + 1.2458) / 3 = 1.2439
What does this number tell us?
It simply tells us that if the market is trading above 1.2439, Bulls are winning the battle pushing the prices higher. And if the market is trading below this 1.2439 the bears are winning the battle pulling prices lower. On both cases this condition is likely to sustain until the next session.
Since the Forex market is a 24hr market (no close or open from day to day) there is a eternal battle on deciding at white time we should take the open, close, high and low from each session. From our point of view, the times that produce more accurate predictions is taking the open at 00:00 GMT and the close at 23:59 GMT.
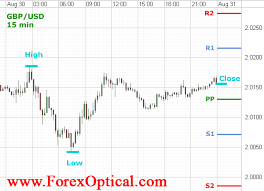
Besides the calculation of the PP, there are other support and resistance levels that are calculated taking the PP as a reference.
Support 1 (S1) = (PP * 2) � H
Resistance 1 (R1) = (PP * 2) – L
Support 2 (S2) = PP � (R1 � S1)
Resistance 2 (R2) = PP + (R1 � S1)
Where , H is the High of the previous period and L is the low of the previous period
Continuing with the example above, PP = 1.2439
S1 = (1.2439 * 2) – 1.2474 = 1.2404
R1 = (1.2439 * 2) � 1.2376 = 1.2502
R2 = 1.2439 + (1.2636 � 1.2537) = 1.2537
S2 = 1.2439 � (1.2636 � 1.2537) = 1.2537
These levels are supposed to mark support and resistance levels for the current session.
On the example above, the PP was calculated using information of the previous session (previous day.) This way we could see possible intraday resistance and support levels. But it can also be calculated using the previous weekly or monthly data to determine such levels. By doing so we are able to see the sentiment over longer periods of time. Also we can see possible levels that might offer support and resistance throughout the week or month. Calculating the Pivot point in a weekly or monthly basis is mostly used by long term traders, but it can also be used by short time traders, it gives us a good idea about the longer term trend.
S1, S2, R1 AND R2…? An Objective Alternative
As already stated, the pivot point zone is a well-known technique and it works simply because many traders and investors use and trust it. But what about the other support and resistance zones (S1, S2, R1 and R2,) to forecast a support or resistance level with some mathematical formula is somehow subjective. It is hard to rely on them blindly just because the formula popped out that level. For this reason, we have created an alternative way to map our time frame, simpler but more objective and effective.
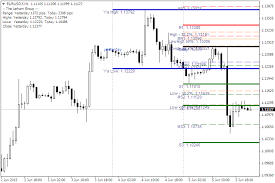
We calculate the pivot point as showed before. But our support and resistance levels are drawn in a different way. We take the previous session high and low, and draw those levels on today�s chart. The same is done with the session before the previous session. So, we will have our PP and four more important levels drawn in our chart.
LOPS1, low of the previous session.
HOPS1, high of the previous session.
LOPS2, low of the session before the previous session.
HOPS2, high of the session before the previous session.
PP, pivot point.
These levels will tell us the strength of the market at any given moment. If the market is trading above the PP, then the market is considered in a possible uptrend. If the market is trading above HOPS1 or HOPS2, then the market is in an uptrend, and we only take long positions. If the market is trading below the PP then the market is considered in a possible downtrend. If the market is trading below LOPS1 or LOPS2, then the market is in a downtrend, and we should only consider short trades.
The psychology behind this approach is simple. We know that for some reason the market stopped there from going higher/lower the previous session, or the session before that. We don�t know the reason, and we don�t need to know it. We only know the fact: the market reversed at that level. We also know that traders and investors have memories, they do remember that the price stopped there before, and the odds are that the market reverses from there again (maybe because the same reason, and maybe not) or at least find some support or resistance at these levels.
What is important about his approach is that support and resistance levels are measured objectively; they aren�t just a level derived from a mathematical formula, the price reversed there before so these levels have a higher probability of being effective.
Our mapping method works on both market conditions, when trending and on sideways conditions. In a trending market, it helps us determine the strength of the trend and trade off important levels. On sideways markets it shows us possible reversal levels.
How we use our mapping method?
We at StraightForex (www.straightforex.com) use the mapping method in three different ways: as a trend identification (measure of the strength of the trend), a trading system using important levels with price behavior as a trading signal and to set the risk reward ratio (RR) of any given trade based on where the is the market relative to the previous session.
Tinggalkan Balasan